Median
When dealing with ordinal data (for example the staging of patient hypertension) where there is an implied ordering to the categories of response, you can use the mode of the distribution of data to determine which category was most frequently reported. Like nominal data, you cannot determine the mean of the distribution of data as it is unclear what the spacing between categories is, and we cannot assume that the spacing is equal.
Along with implied ordering of categories comes the use of the median value of the distribution of data to determine which category lies between the top half of the data and the bottom half of the data, as we know which category is higher or lower than the other.
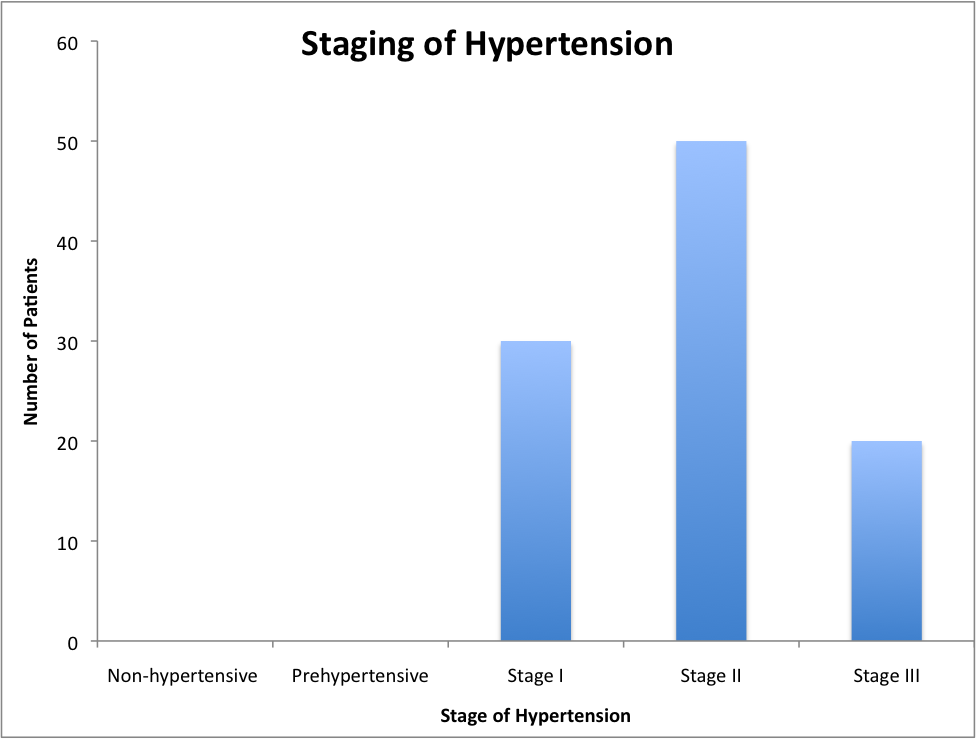
For example, if we look at the hypertension study and consider the classification of patients based on their staging of their hypertension, we see that there are 5 categories of hypertension staging:
- Non hypertensive
- Prehypertensive
- Stage I hypertension
- Stage II hypertension
- Stage III hypertension