Types of Data and Measures of Central Tendency
Mean
For quantitative data sets, we can use the mode and median values of the distribution of data, but we are now able to use the mean value. The mean is simply the average of the values in the data set.
The mean is a useful statistic for predicting future outcomes, when there are no extremes in the data set. However, as you will see in the next section of the module, extreme values in a data set can have a large impact on the significance and usefulness of the mean statistic.
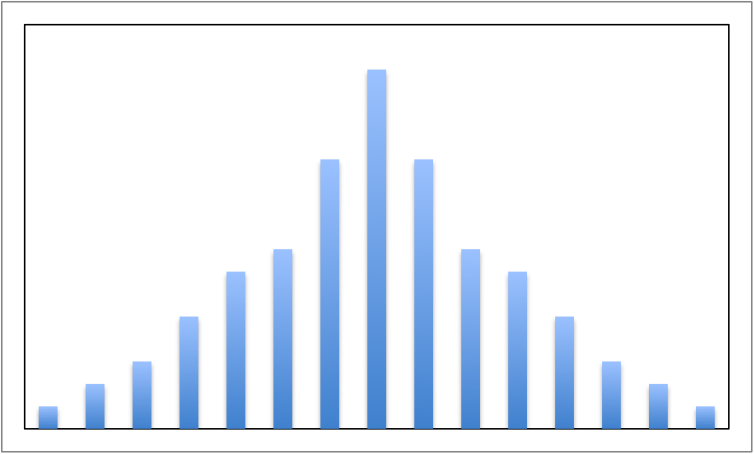
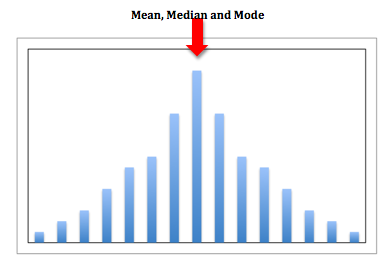
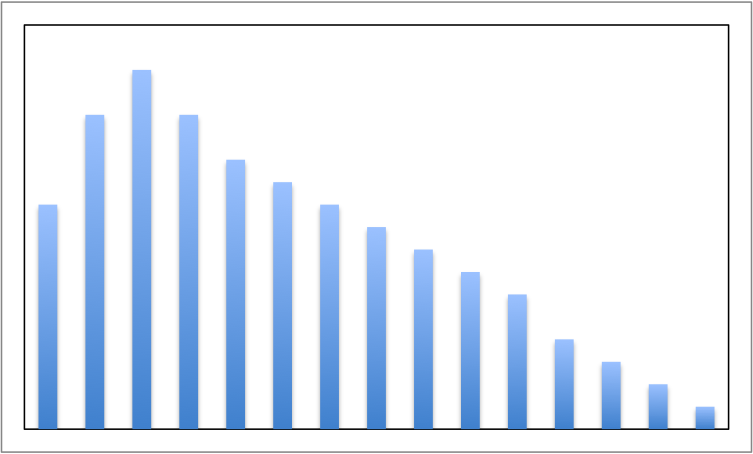
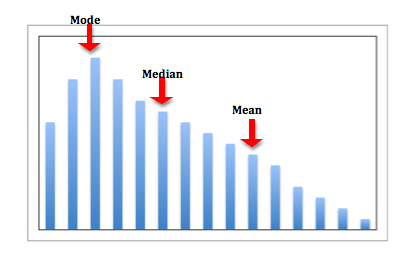
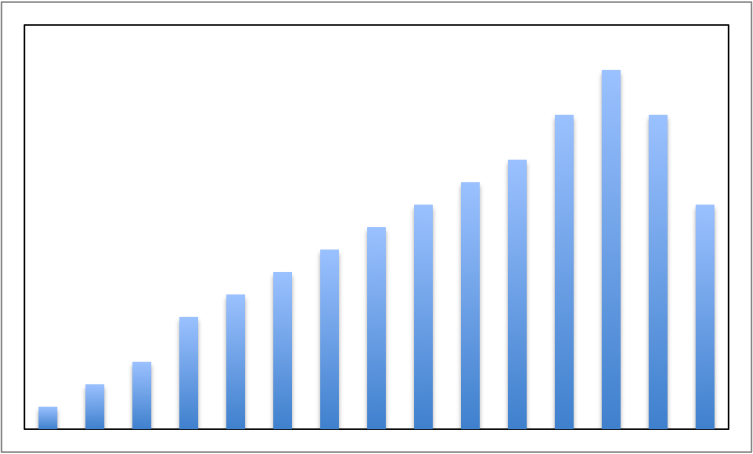
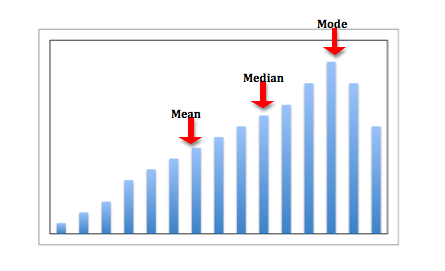
What are rough estimates of the mean, median and mode for 3 graphs shown below?
Note: Rough estimations! No calculating necessary, simply draw a line where you believe the mean is for each graph.