Standard Deviation and Confidence Intervals
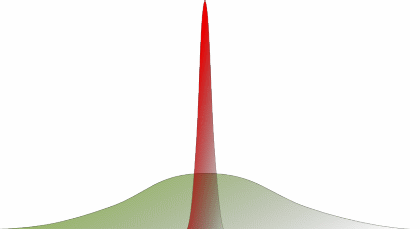
You determine through the measures of central tendency, that mean systolic blood pressure for the treatment group was 140mmHg. Here is a graph with two sets of data from the hypertension study. In both of these data sets the mean, median and mode are all 140 mmHg (not labeled).

Despite the fact that the mean, median and mode are all the same the graphs look very different from one another. This is because the results in one graph are much more precise (refer back to the Precision module) than the results in the other.
We need a way to understand the precision of our mean (or measure of central tendency). Range and interquartile range are one way of understanding more about the shape of the curve.
The standard deviation is another way to understand the precision of the data and is commonly seen in published medical research. It is essentially the average of the distance of each individual measurement from the mean of the data set.
From the graph shown above, which data set (red or green) is more precise? Which data set has the larger standard deviation?
|
The value of the 95% confidence interval contains the true mean 5% of the time.
| |
|
The more narrow a 95% confidence interval is, the more certain one can be above the size of the true effect.
| |
|
If the 95% confidence interval for the mean systolic blood pressure for patients taking brachenolol was 120-140 mmHg, you can be 95% sure that the true population mean would be 120 mmHg.
| |
|
The 95% confidence interval is not commonly used in the medical literature, and therefore is relatively unimportant
|