Asymmetrical Data
Now lets look at an example when the data set is not normally distributed and how that effects the use of certain measures of central tendency.
You want to look at the ages of patients that fall into Stage II Hypertension to determine which population of patients suffer most frequently from this degree of hypertension.
You gather your data and make a graph which is plotted below.
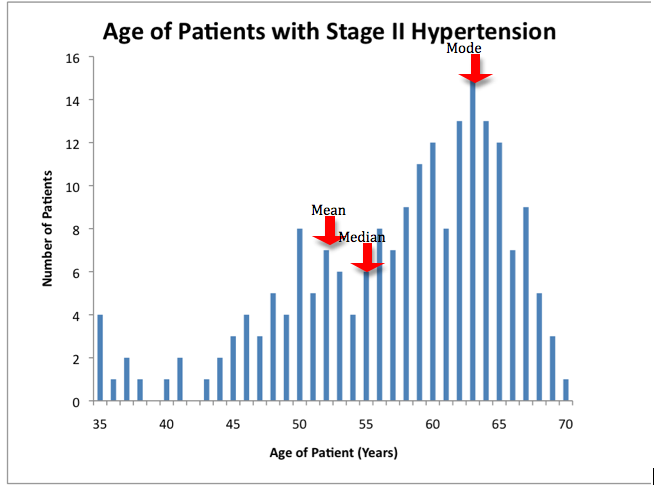
You notice something strange about the data, although the largest number of patients with Stage II hypertension are 63 years old (the mode), you discover that the median is 55 years old and the mean is even younger at 53 years old. You wonder why you have found this discrepancy in the values for the measures of central tendency.
There is discrepancy in these values because the data is "skewed", rather than "normal." Although the majority of patients with Type II hypertension are elderly patients, there are a few younger patients that have also been diagnosed with Type II hypertension, and because of these extreme ages (compared to the majority of patients in this data set) the median and mean of this data are "pulled" toward the younger ages.
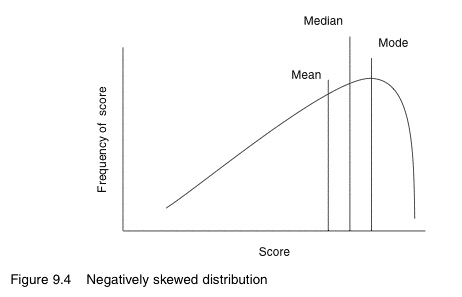
Skewed data sets typically have one tail that is longer than the other.
Generally, if a curve has one tail longer than the other, the mean is always toward the long tail, the mode nearer the short tail, and the median somewhere between the two.
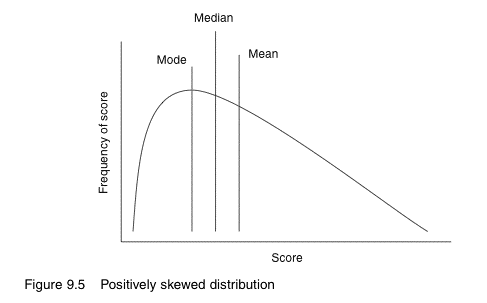
In the example above, the data set is said to be negatively skewed, as the longer tail is towards to smaller values (i.e. younger ages). If the longer tail is towards the larger values, it is said to be positively skewed.
With skewed data sets, the mean value is not an accurate representation of the most common value nor is it an accurate representation of the middle value of the data set, as it is for normally distributed data.
Statistics for Health Care Professionals : An Introduction